Data AnalyticsExample data
Ship Velocity
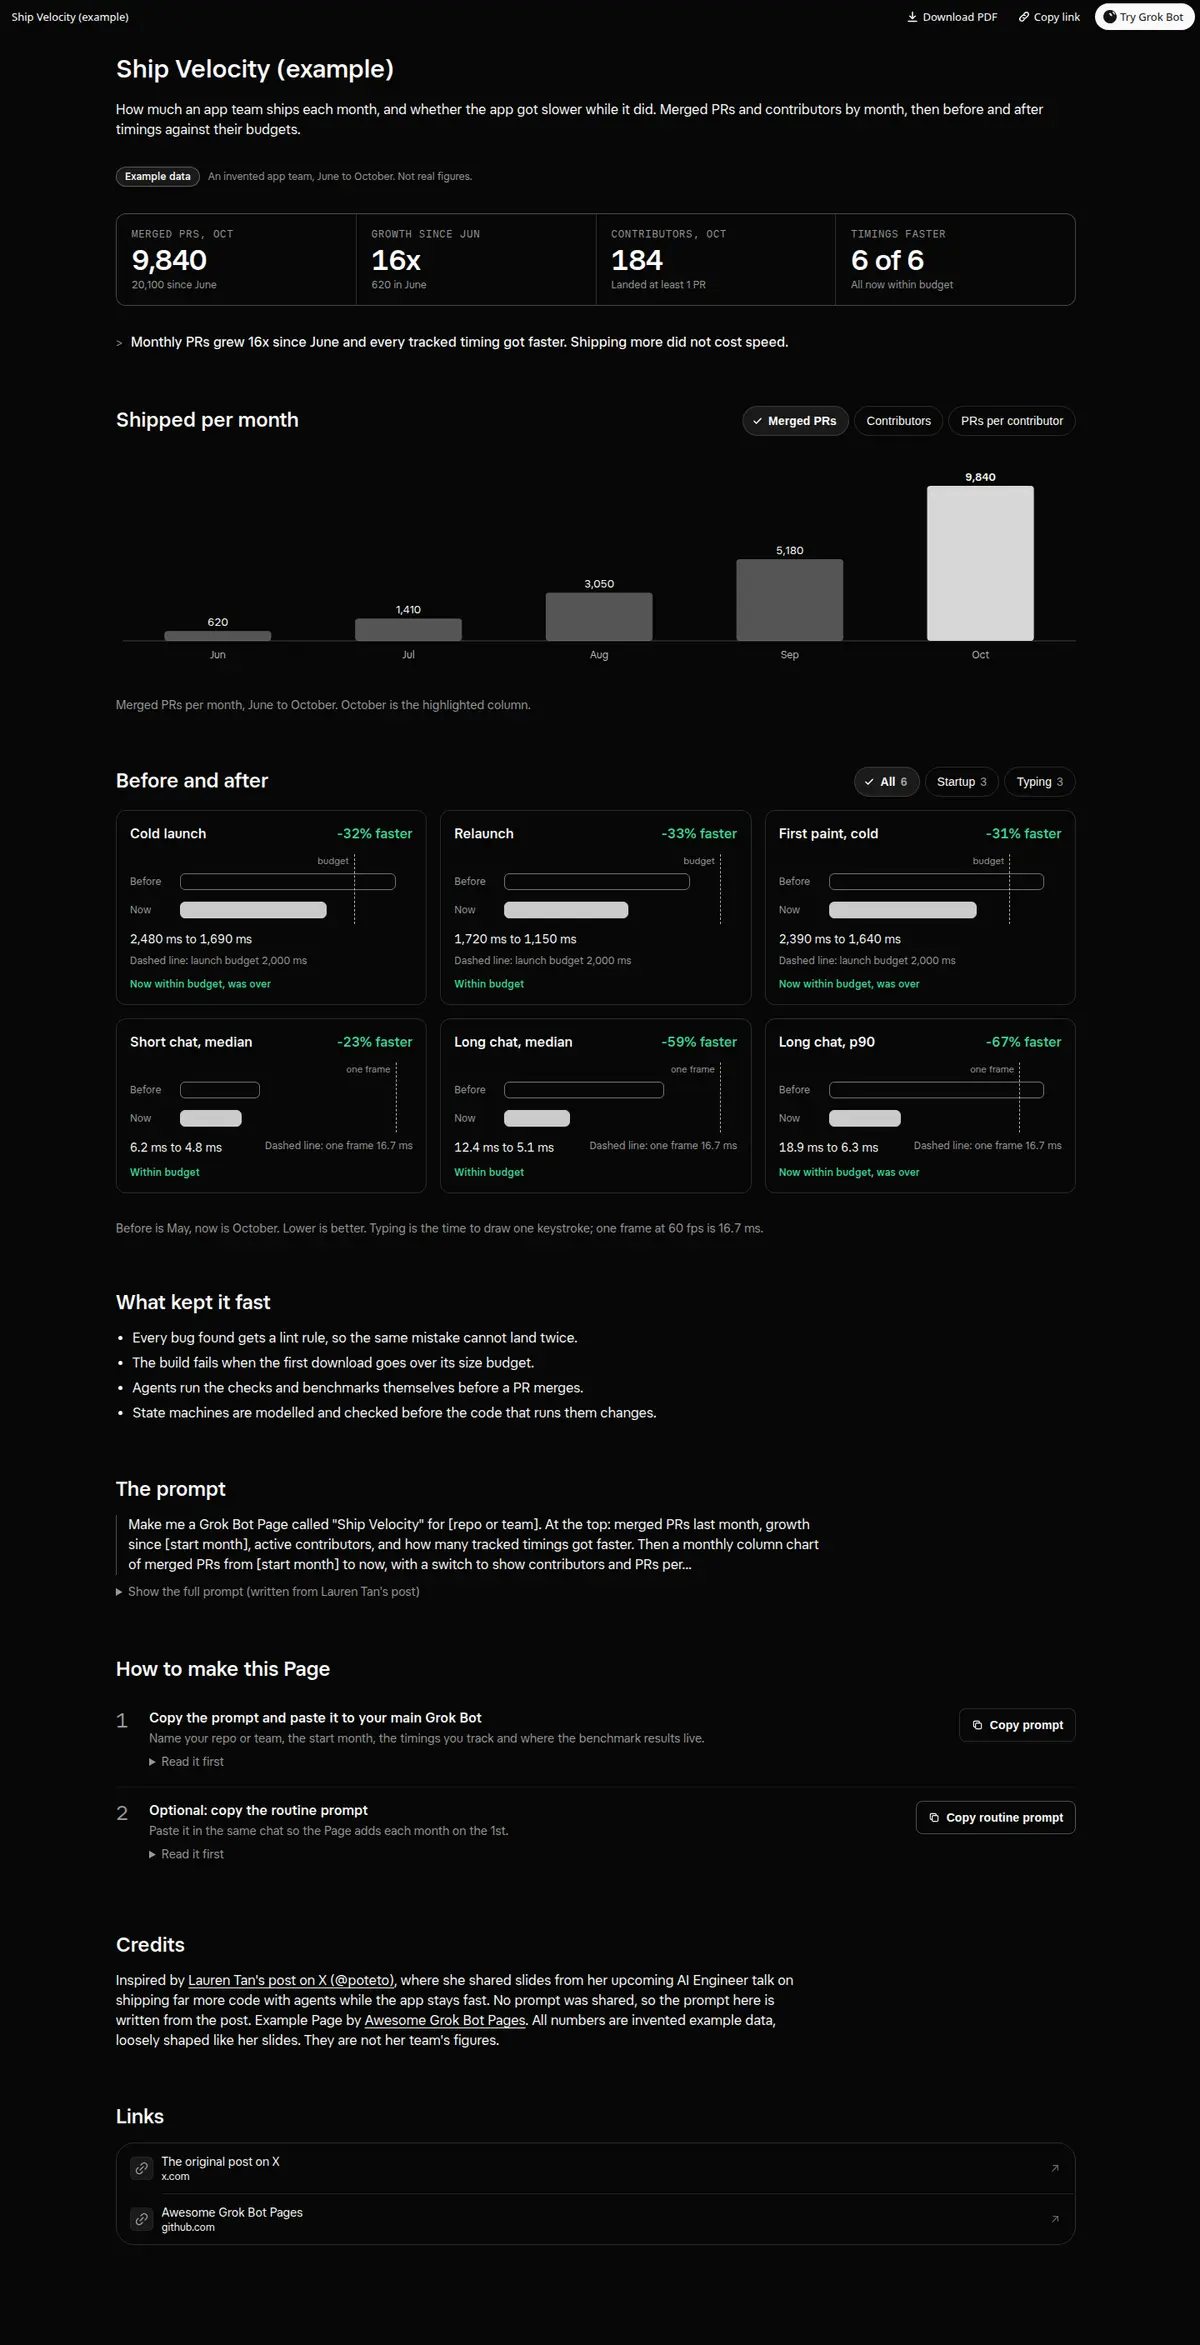
An engineering ship velocity dashboard: merged PRs per month with a switch to contributors and PRs per contributor, and before and after performance cards with % change and a frame or launch budget line.
Data from Agent Analytics, recommended for dashboard data.
Prompt
Paste into Grok Bot
Make me a Grok Bot Page called "Ship Velocity" for [repo or team]. At the top: merged PRs last month, growth since [start month], active contributors, and how many tracked timings got faster. Then a monthly column chart of merged PRs from [start month] to now, with a switch to show contributors and PRs per contributor. Then before and after cards for each performance timing I track ([for example cold launch, relaunch, first paint, typing latency median and p90]): the old value, the new value, the % change, and a dashed budget line (one frame, 16.7 ms, for typing; [my launch budget] for startup). Put any timing that got slower or is over its budget first. Use merged PR counts from GitHub for [repo] and timings from [benchmark source]. Say where each number comes from, and leave a metric out rather than guess.
Routine prompt (optional)
Keeps the Page updated
Create a routine for my "Ship Velocity" Page: on the 1st of each month at 09:00, add last month's merged PRs and contributors from GitHub, read the latest benchmark results, update the before and after cards, and keep the layout the same. If a timing got slower or went over its budget, put it first and tell me.
How to use it
- Copy the prompt and paste it into a chat with Grok Bot.
- Swap in your own bots, accounts or data sources where the prompt asks for them.
- If the prompt does not create a refresh routine, ask Grok Bot for one.
- To share your version, make a copy with mock data and make that copy public. Then get it listed.