Data AnalyticsExample data
Cheapest Power Hours
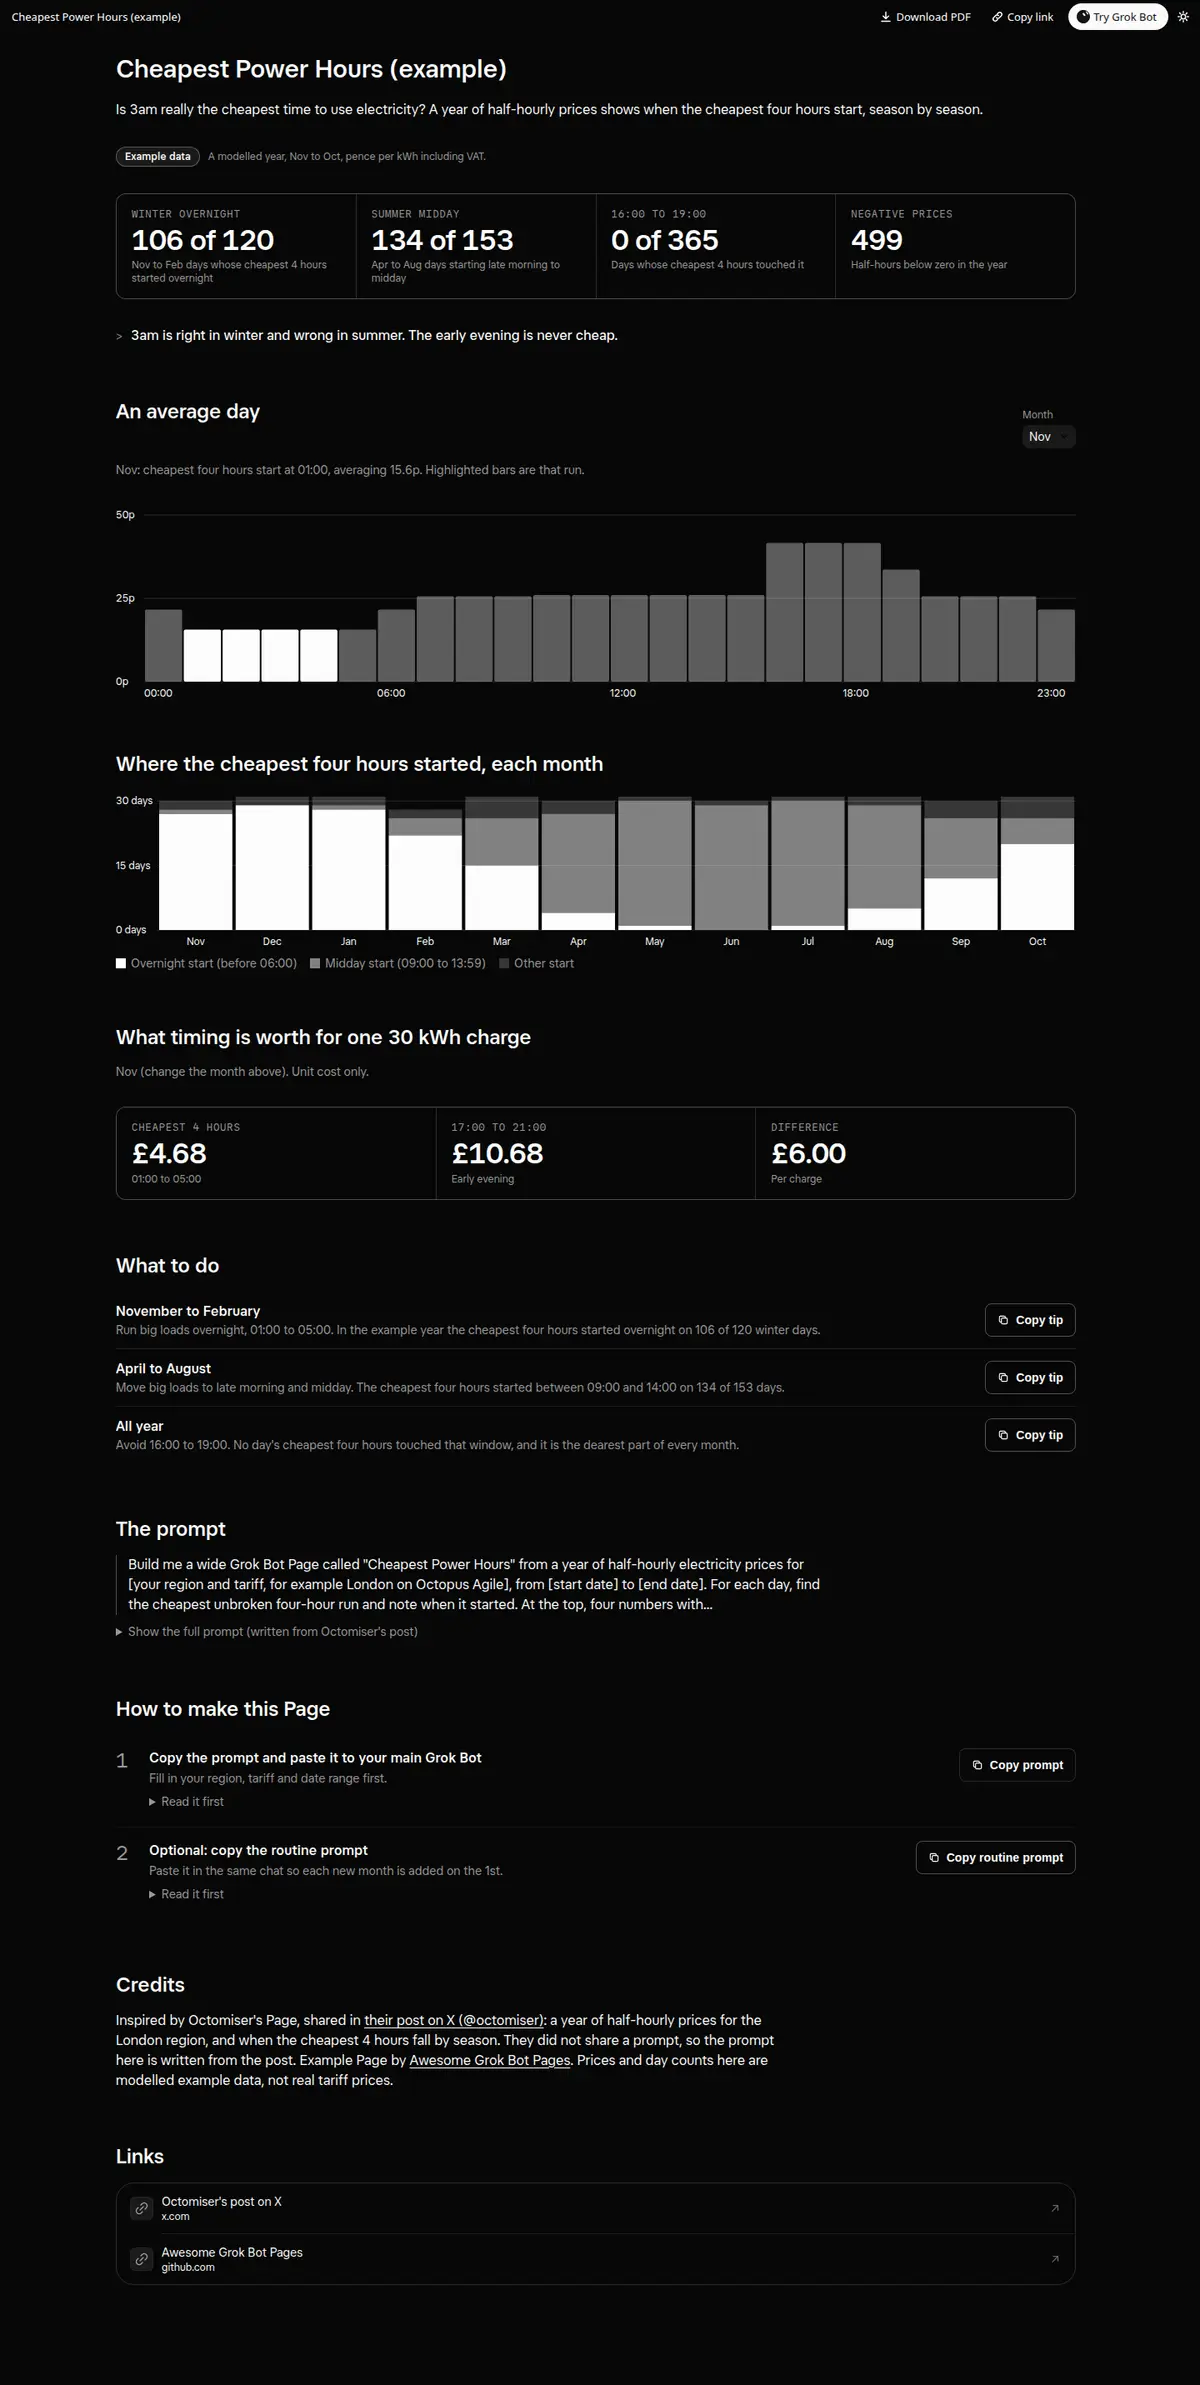
A year of half-hourly power prices for one region: when the cheapest four hours start by season, an hourly price chart with a month picker, start times per month, and what one 30 kWh charge costs when timed well or badly.
Data from Agent Analytics, recommended for dashboard data.
Prompt
Paste into Grok Bot
Build me a wide Grok Bot Page called "Cheapest Power Hours" from a year of half-hourly electricity prices for [your region and tariff, for example London on Octopus Agile], from [start date] to [end date]. For each day, find the cheapest unbroken four-hour run and note when it started. At the top, four numbers with the exact counts: winter days (November to February) whose cheapest 4 hours started overnight, spring and summer days (April to August) whose cheapest 4 hours started late morning to midday, days whose cheapest 4 hours touched 16:00 to 19:00, and negative-price half-hours. Then an hourly bar chart of the average price per clock hour with a month picker, so I can flip between winter and summer. Then a stacked chart of overnight, midday and other start times per month. Then a cost calculator: one 30 kWh load in the cheapest 4 hours against 17:00 to 21:00, per month. Then a short "What to do" list by season with a Copy button on each tip. Use pence per kWh including VAT, label every chart, and say which numbers are measured and which are explanation. Every control must really work on the Page.
How to use it
- Copy the prompt and paste it into a chat with Grok Bot.
- Swap in your own bots, accounts or data sources where the prompt asks for them.
- If the prompt does not create a refresh routine, ask Grok Bot for one.
- To share your version, make a copy with mock data and make that copy public. Then get it listed.